

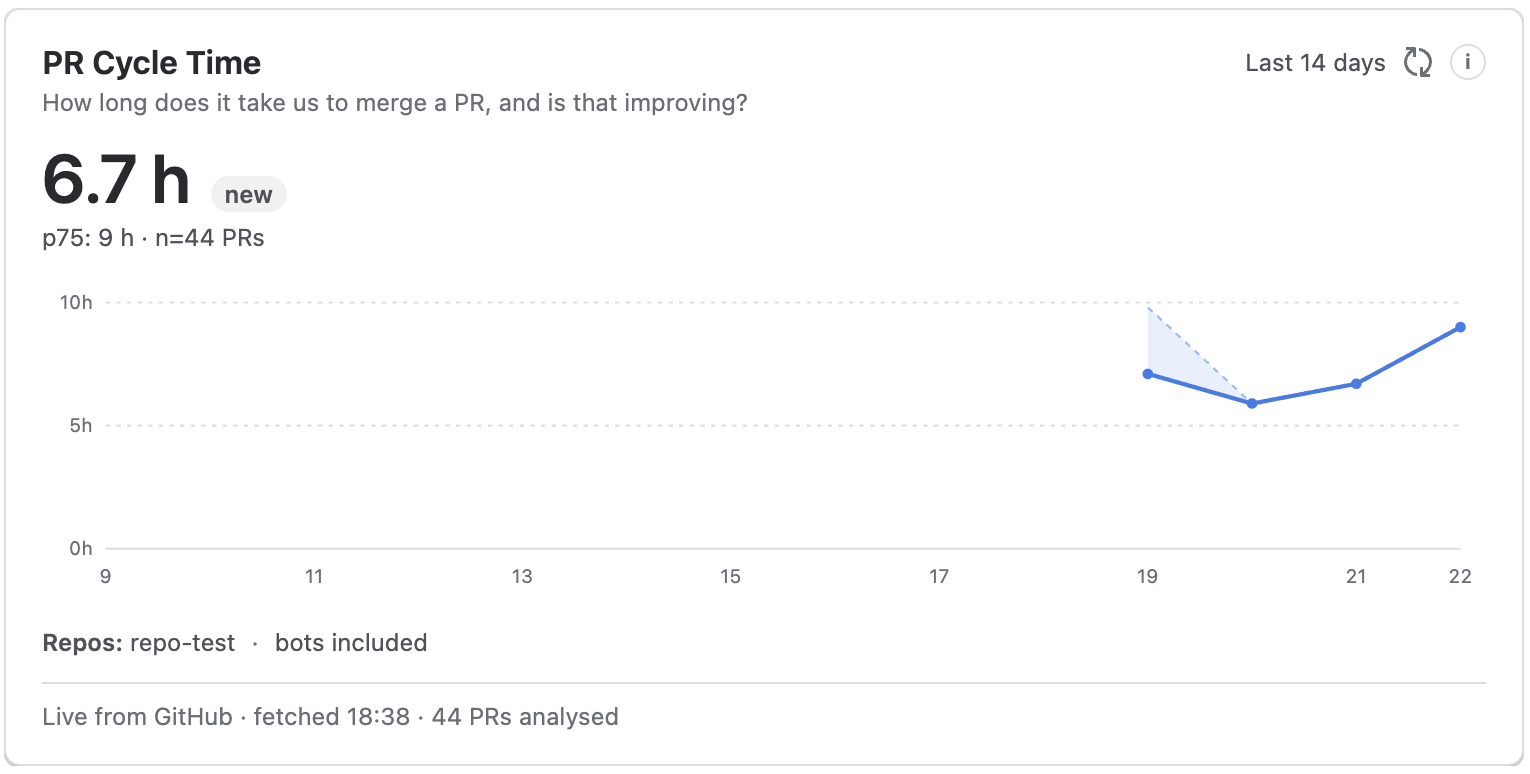
The PR Cycle Time macro shows how long it takes for a pull request to go from opened to merged, and whether that time is improving. Data is fetched live from GitHub on each page load.
A long cycle time can signal review bottlenecks, large PRs, or scope creep. Read it alongside PR Throughput report and Review Latency report for a fuller picture of team flow.
Adding the macro to a page
-
Open a Confluence page in edit mode.
-
Type
/PR Cycle Timeor click + and search for PR Cycle Time (GitHub). -
The configuration panel opens on the right.
-
Set your options and click Save.
Configuration options
|
Option |
Description |
|---|---|
|
Repositories (required) |
Select one or more GitHub repositories. Type to search within your connected organisation. |
|
Date range |
Last 14 days, Last 30 days (default), or Last 90 days. |
|
Display |
Full (KPI + chart) or Compact (KPI tile) for dashboards. 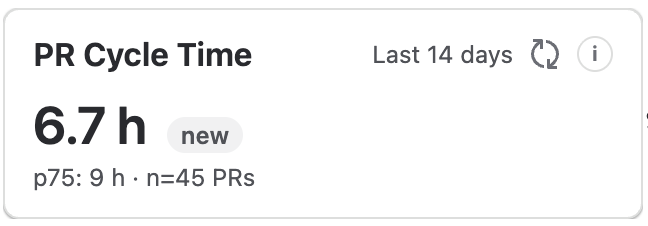
|
|
Compare to previous period |
Show whether the metric improved vs. the prior period. Enabled by default. |
|
Exclude bot / Dependabot PRs |
Filter out bot-authored PRs to avoid skewing the average. Enabled by default. |
|
Title (optional) |
Custom heading. Defaults to PR Cycle Time - {selected repositories}. |
Metrics are computed from PRs the connected GitHub App can access. Repositories not included in the App's repository access will not appear in search results.
What is measured
Cycle time is calculated from the moment a PR is opened to the moment it is merged. Closed-without-merge PRs are excluded.
The macro shows:
-
The median cycle time across all PRs merged in the selected period, plus the 75th percentile (p75) per chart bucket
-
A trend indicator vs. the previous period
-
A trend chart over time (Full display only)
Reading the chart: A lower or flatter trend means smoother flow. Spikes typically indicate large or stalled PRs, or review bottlenecks. Metrics are team-level only - never per-developer.
Related pages
-
PR Throughput report - how many PRs your team is merging over time
-
Review Latency report - how long PRs wait before receiving their first review
-
How metrics are calculated - full definitions and data sourcing detail
-
Preparing sprint retrospectives - using the reporting macros alongside PR and issue data
Updated: