

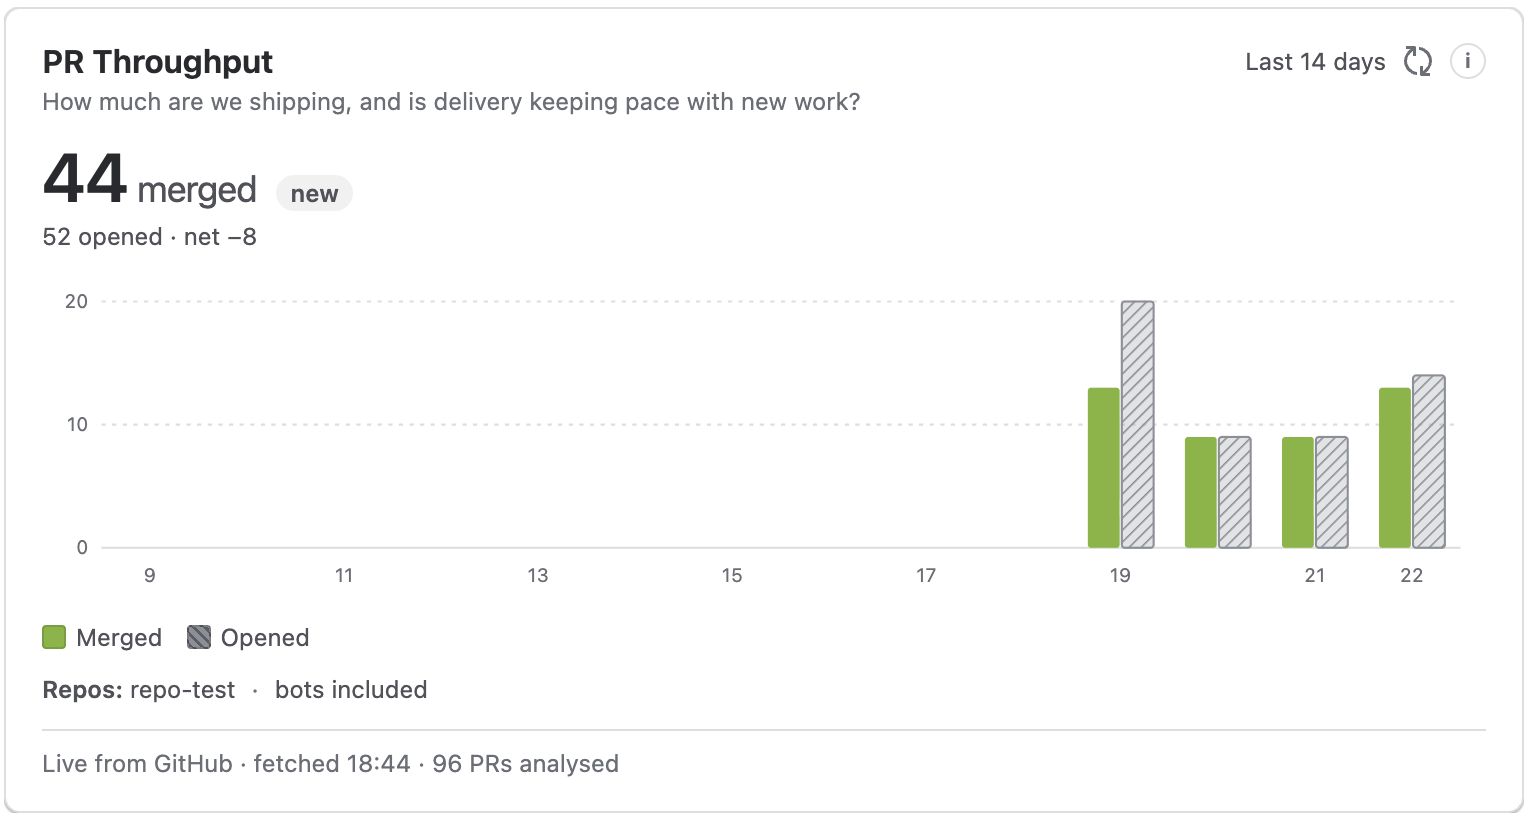
The PR Throughput macro shows how many pull requests your team is completing over time, and optionally compares that to how many new PRs are being opened. Data is fetched live from GitHub.
Rising throughput with stable or falling cycle time indicates a healthy, improving team flow. Read it alongside PR Cycle Time report and Review Latency report.
Adding the macro to a page
-
Open a Confluence page in edit mode.
-
Type
/PR Throughputor click + and search for PR Throughput (GitHub). -
The configuration panel opens on the right.
-
Set your options and click Save.
Configuration options
|
Option |
Description |
|---|---|
|
Repositories (required) |
Select one or more repositories. Type to search within your connected organisation. |
|
Date range |
Last 14 days, Last 30 days (default), or Last 90 days. |
|
Display |
Full (KPI + chart) or Compact (KPI tile). 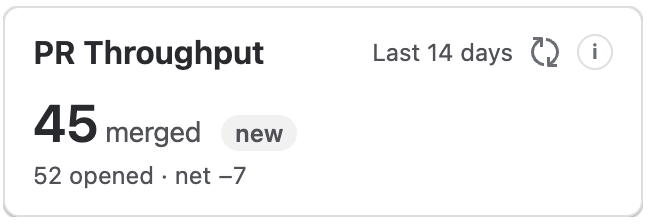
|
|
Compare to previous period |
Compare merged PR count to the prior equivalent period. Enabled by default. |
|
Exclude bot / Dependabot PRs |
Filter out bot-authored PRs. Enabled by default. |
|
Show opened PRs alongside merged |
When enabled (default), the chart shows both merged and opened PR counts side by side, making it easy to see whether work is accumulating or being cleared. |
|
Title (optional) |
Custom heading. Defaults to PR Throughput - {selected repositories}. |
What is measured
-
Merged PRs - count of PRs merged in the selected period, bucketed by
mergedAt. Both boundary dates are included: the window runs from the start of UTC day N through the end of UTC day N+window-1. -
Opened PRs (optional) - number of new PRs opened in the same period, shown alongside merged to indicate backlog growth or reduction
-
A trend chart over time (Full display only)
Reading the chart: Count of completed PRs per interval. A rising merged count with a stable or falling opened count indicates work is being cleared faster than it arrives. Metrics are team-level only - never per-developer.
Related pages
-
PR Cycle Time report - average time from PR opened to merged
-
Review Latency report - how long PRs wait before receiving their first review
-
How metrics are calculated - full definitions and data sourcing detail
-
Preparing sprint retrospectives - using the reporting macros alongside PR and issue data
Updated: